
How Moast analytics works
Updated 2 months ago
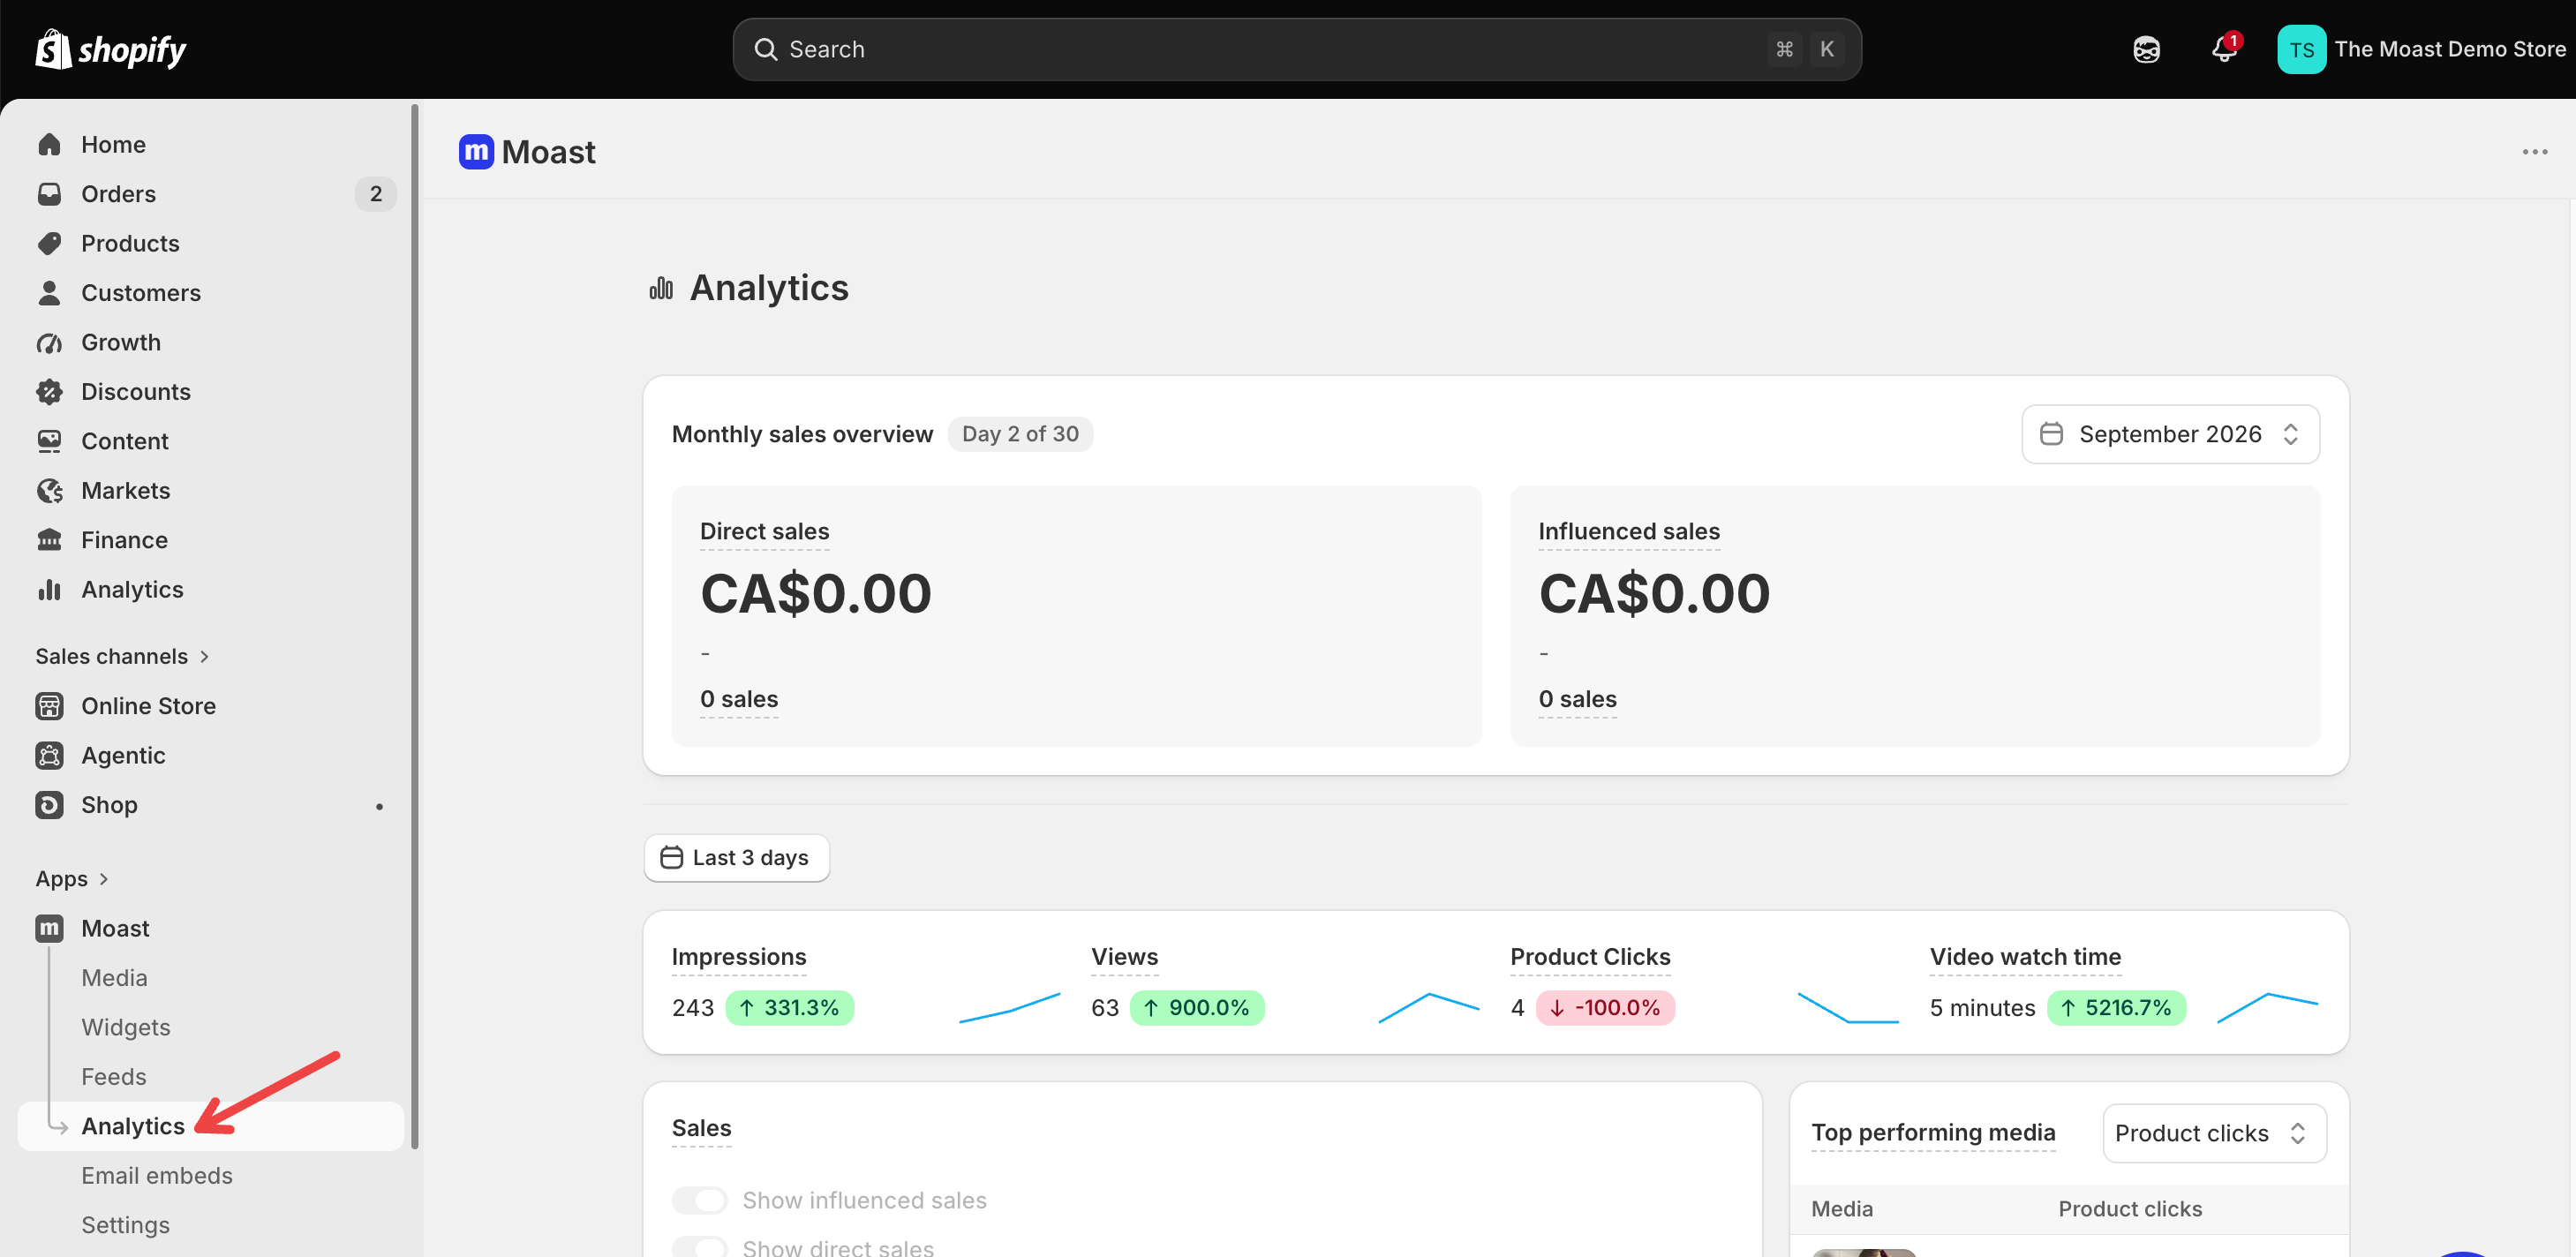
The Analytics section shows how your shoppable videos perform. You open it from the Moast menu in your Shopify admin. It shows your monthly sales, a set of performance numbers for any date range you choose, and which of your videos are doing the best.
What the numbers mean
The main Analytics page shows four numbers at a glance. Each one counts something different about how customers interact with your videos.
Impressions — how many times a Moast widget loaded on your site and was seen by a customer. Each widget counts once, no matter how long it stays on screen.
Views — how many times a video was actually watched. A view is counted when a customer clicks a video to open the player and watches a video for at least a second.
Product clicks — how many times a customer clicked a product card or buy button inside a video (this only applies if you have products tagged on your videos).
Video watch time — the total time customers spent watching your videos. Paused time is not included.
Sales
Moast tracks two kinds of sales so you can see both the direct and the indirect effect your videos have on revenue.
Direct sales — a customer watched a video, clicked the product card, and bought that product.
Influenced sales — a customer watched one of your videos and later made a purchase, even if they did not click the product card.
Sales are shown in your shop's currency, and a US dollar amount is also shown when your shop uses a different currency. Sales in different currencies are kept separate and are never added together.
The sales chart
The Sales chart shows your daily sales for the date range you pick. Each day is one point on the chart, so you can see how your revenue changed day by day.
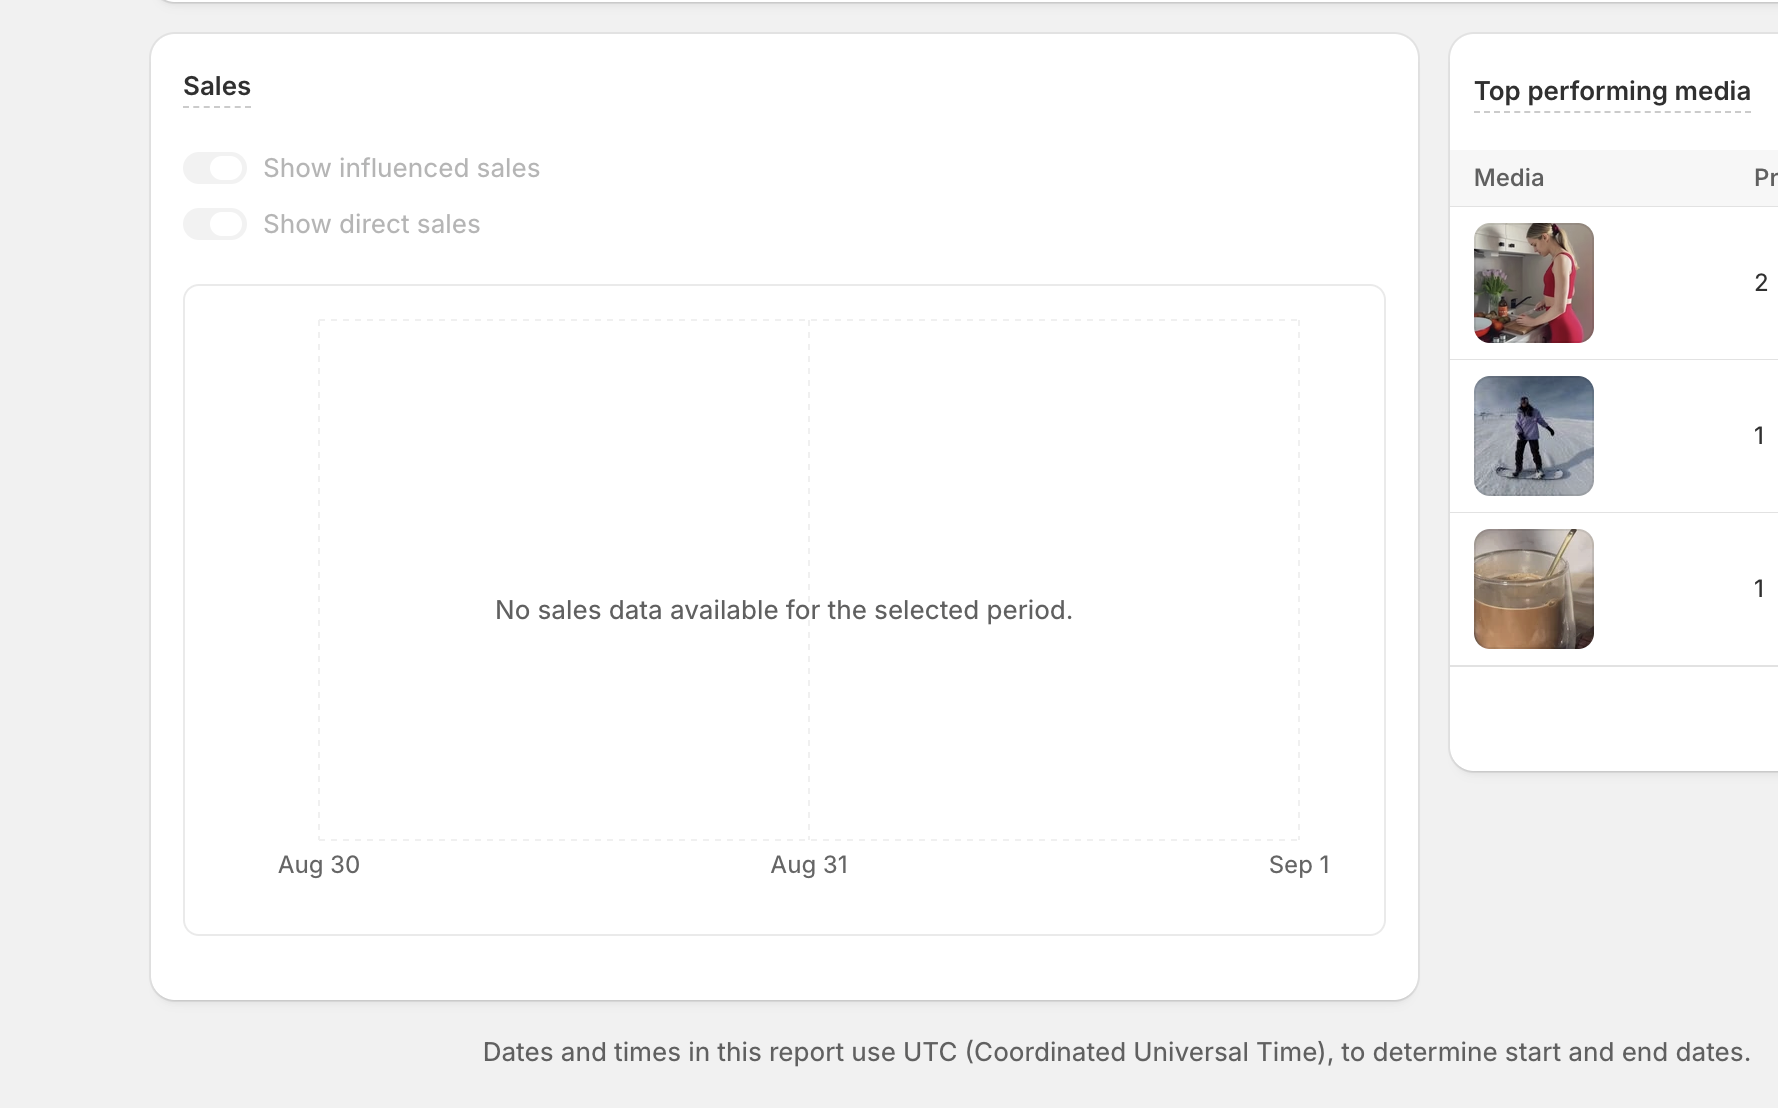
The chart draws two lines. Influenced sales is a solid line and direct sales is a dashed line. Both are shown by default.
Use the Show influenced sales and Show direct sales switches to turn a line on or off. Turning one off hides that line and dims its total below the chart.
Sales in different currencies are never added together. If you sell in more than one currency, each currency gets its own line and its own total below the chart. When you have more than one currency, you can click a currency's total to show only that currency on the chart.
If there are no sales in the period you picked, the chart shows No sales data available for the selected period.
How each number is captured
These numbers are collected automatically as customers use your site. You do not need to set anything up.
Impressions are recorded when a widget loads on a page and is seen by a customer.
Views and watch time are recorded while a customer watches a video on your site.
Product clicks are recorded when a customer clicks a product card or buy button in a video.
Direct sales are matched to the video when a customer clicks a product card and then buys that exact product.
Influenced sales are matched to your content when a customer watches any of your videos and later makes a purchase, even if they never clicked a product card.
Choose a date range
Use the date picker to look at a specific period. You can choose Today, Yesterday, the last 3, 7, 30, or 90 days, or set a custom range. The page starts on the last 3 days ending yesterday.
Remember that the numbers on the Analytics page are for the date range you pick, while the numbers on the Media page are lifetime totals. That is why the same metric can look different on the two pages.
Dates and times in this report use UTC (Coordinated Universal Time) to determine start and end dates.
See Why impression numbers are different on the Media and Home pages for more.
Top performing media
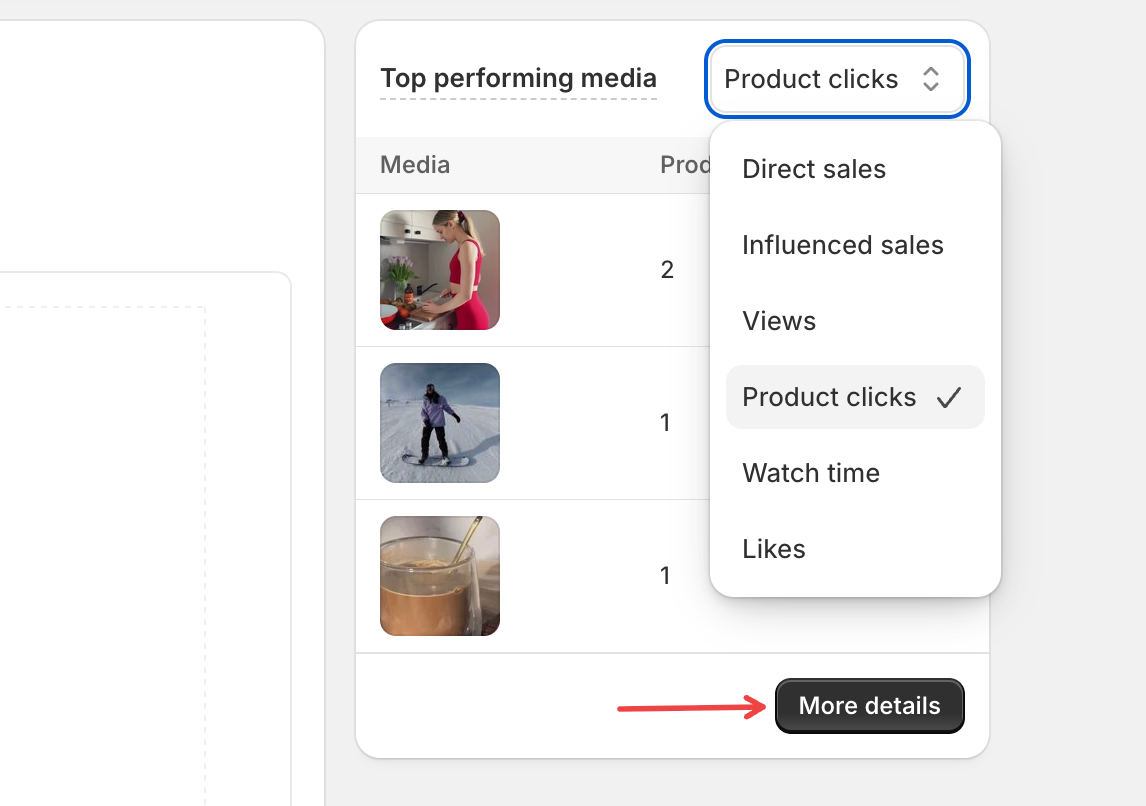
This list ranks your videos by the metric you choose. You can sort by sales, influenced sales, views, product clicks, watch time, or likes. It starts on product clicks.
When you sort by a sales metric and your shop has more than one currency, a currency selector appears. Select a video to see its details, or click More details to open the full list.
Export your analytics
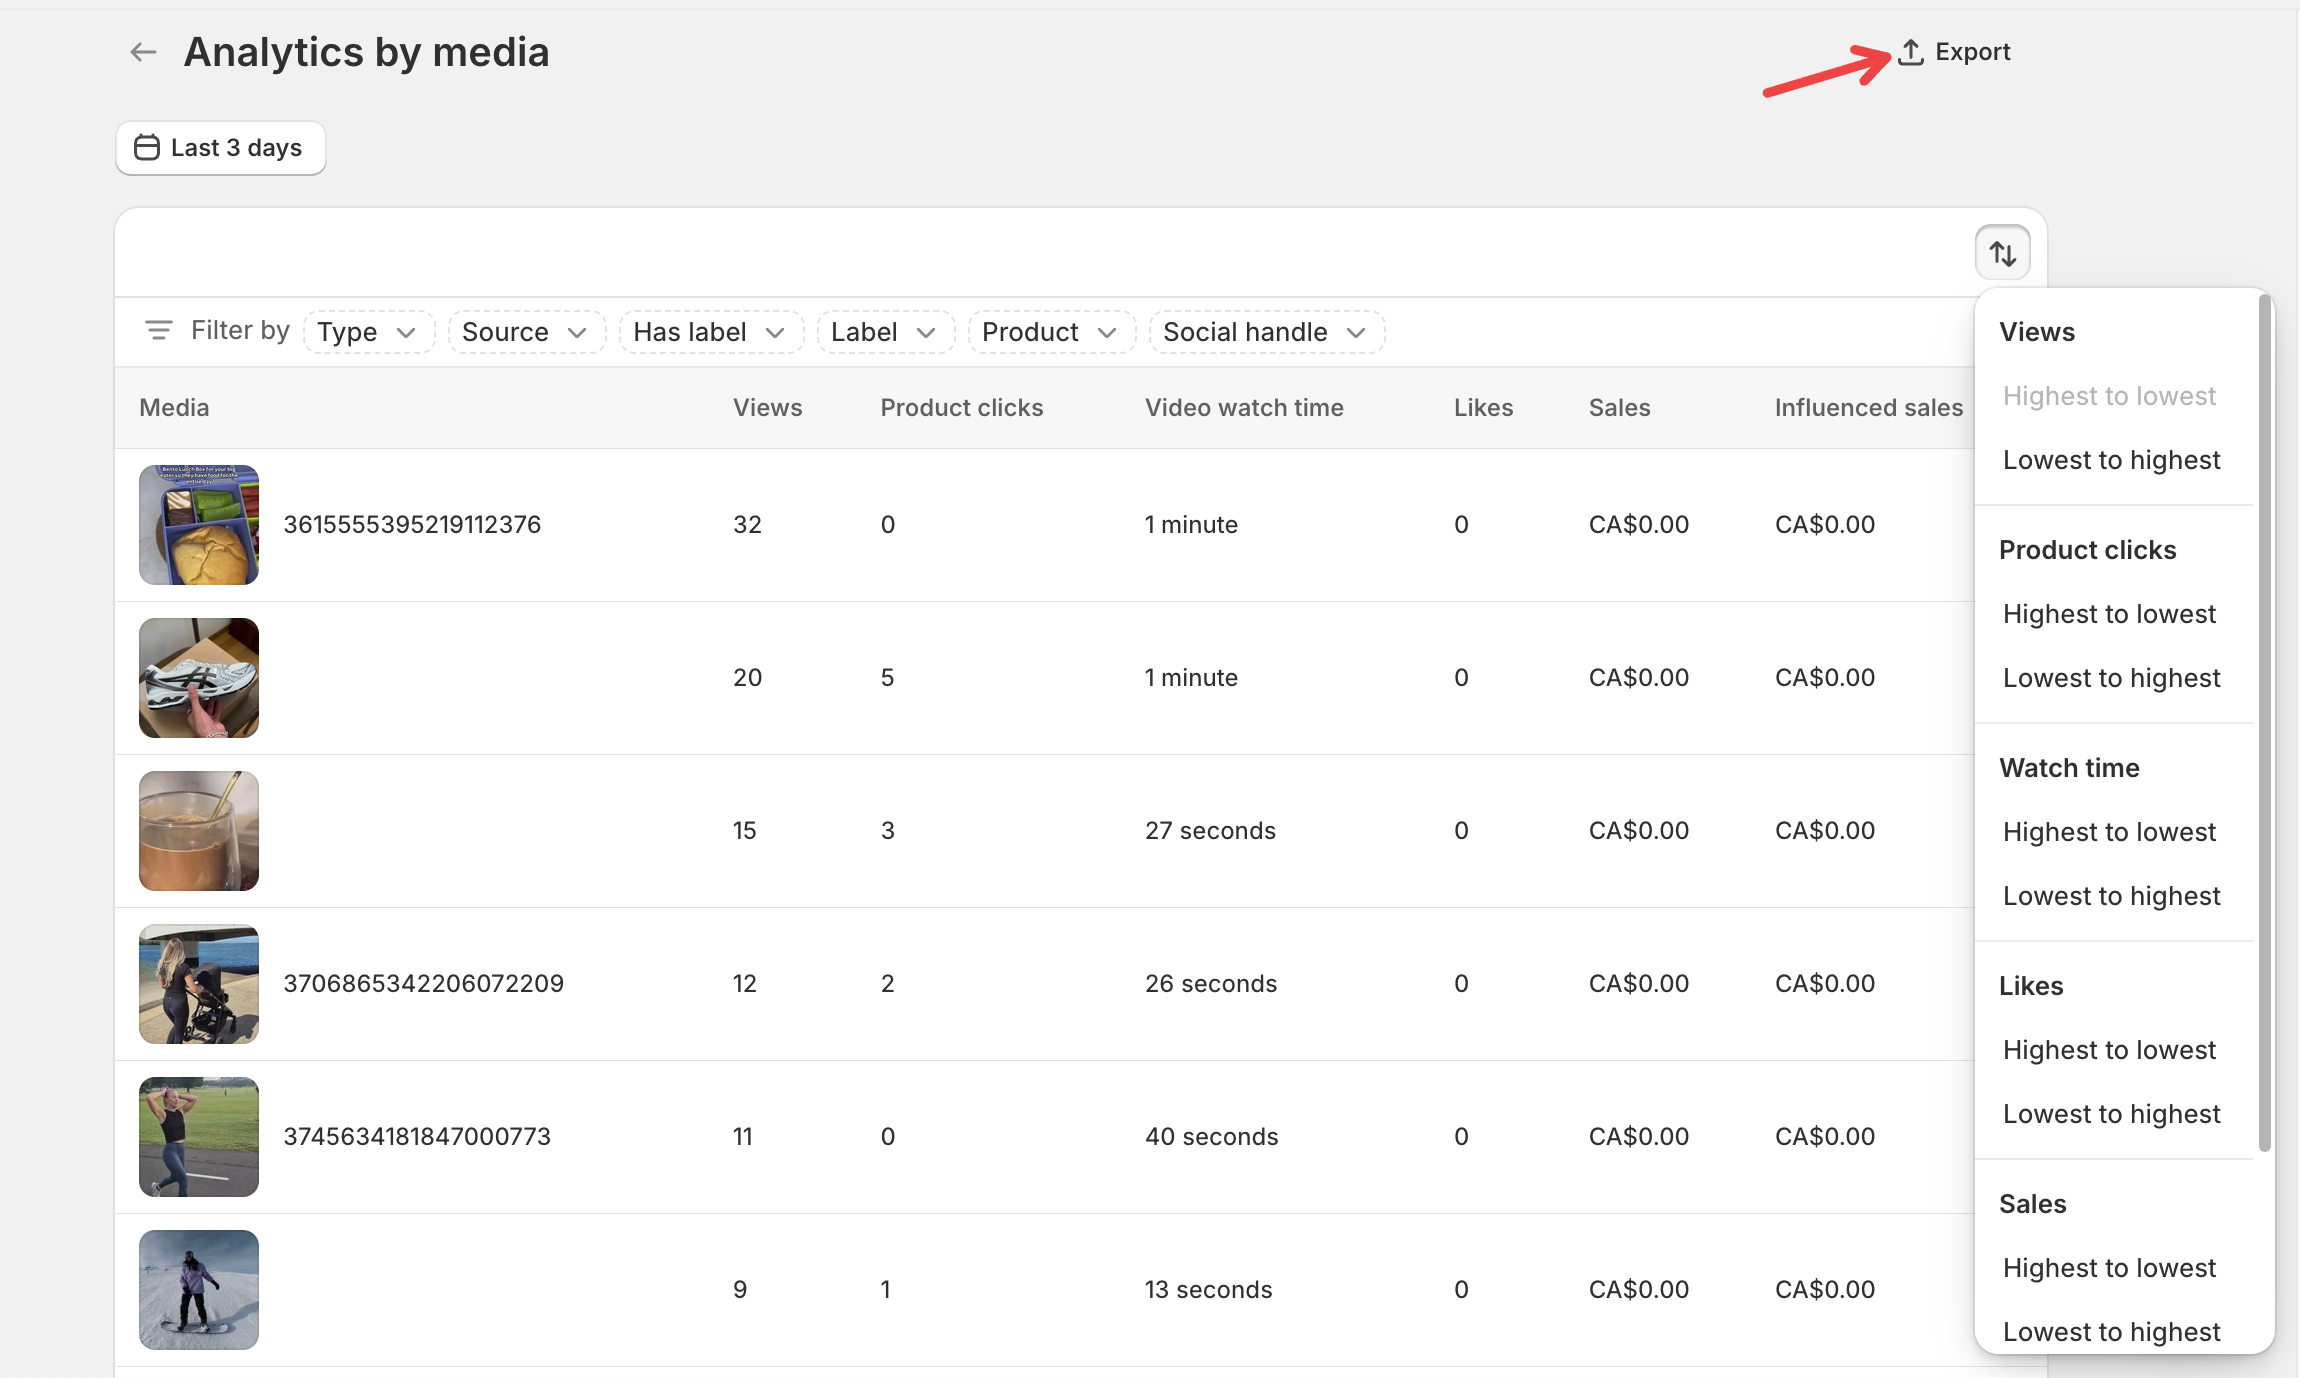
This report lists every video with its views, product clicks, video watch time, likes, sales, and influenced sales. You can sort the list by any of these numbers, filter it to a narrower set, and export it as a CSV file.
Click Export to download the report as a CSV file. The download uses the date range, filters, and sort order you have set and includes the full report, not just the page you are looking at.
When more than 10,000 media match your filters, the report keeps the newest 10,000 and shows a message telling you to narrow the filters to see the rest.
Related articles
Media library and stats — lifetime totals on the Media page.
Use Moast with Shopify Sidekick — ask Shopify Sidekick about your performance.